Getting started
Install
Windows
- Download the installer.
- Ignore "Unknown publisher" warnings (we're working on this).
- Follow the instructions of the installer.
- Sign in from the CLtracer app.
Linux
- Download the AppImage.
- Make it executable:
chmoad a+x CLtracer.AppImage. - Run the AppImage.
- Sign in from the CLtracer app.
Refer Limitations and Troubleshooting sections of the documentation.
Subscription
To use CLtracer you need to have an active subscription. We offer a 32-day free trial. To activate a paid subscription or free trial, visit your account page. In the app, you can review the current status of the subscription from the main menu. Click Subscription menu item to re-check subscription status.
Basics
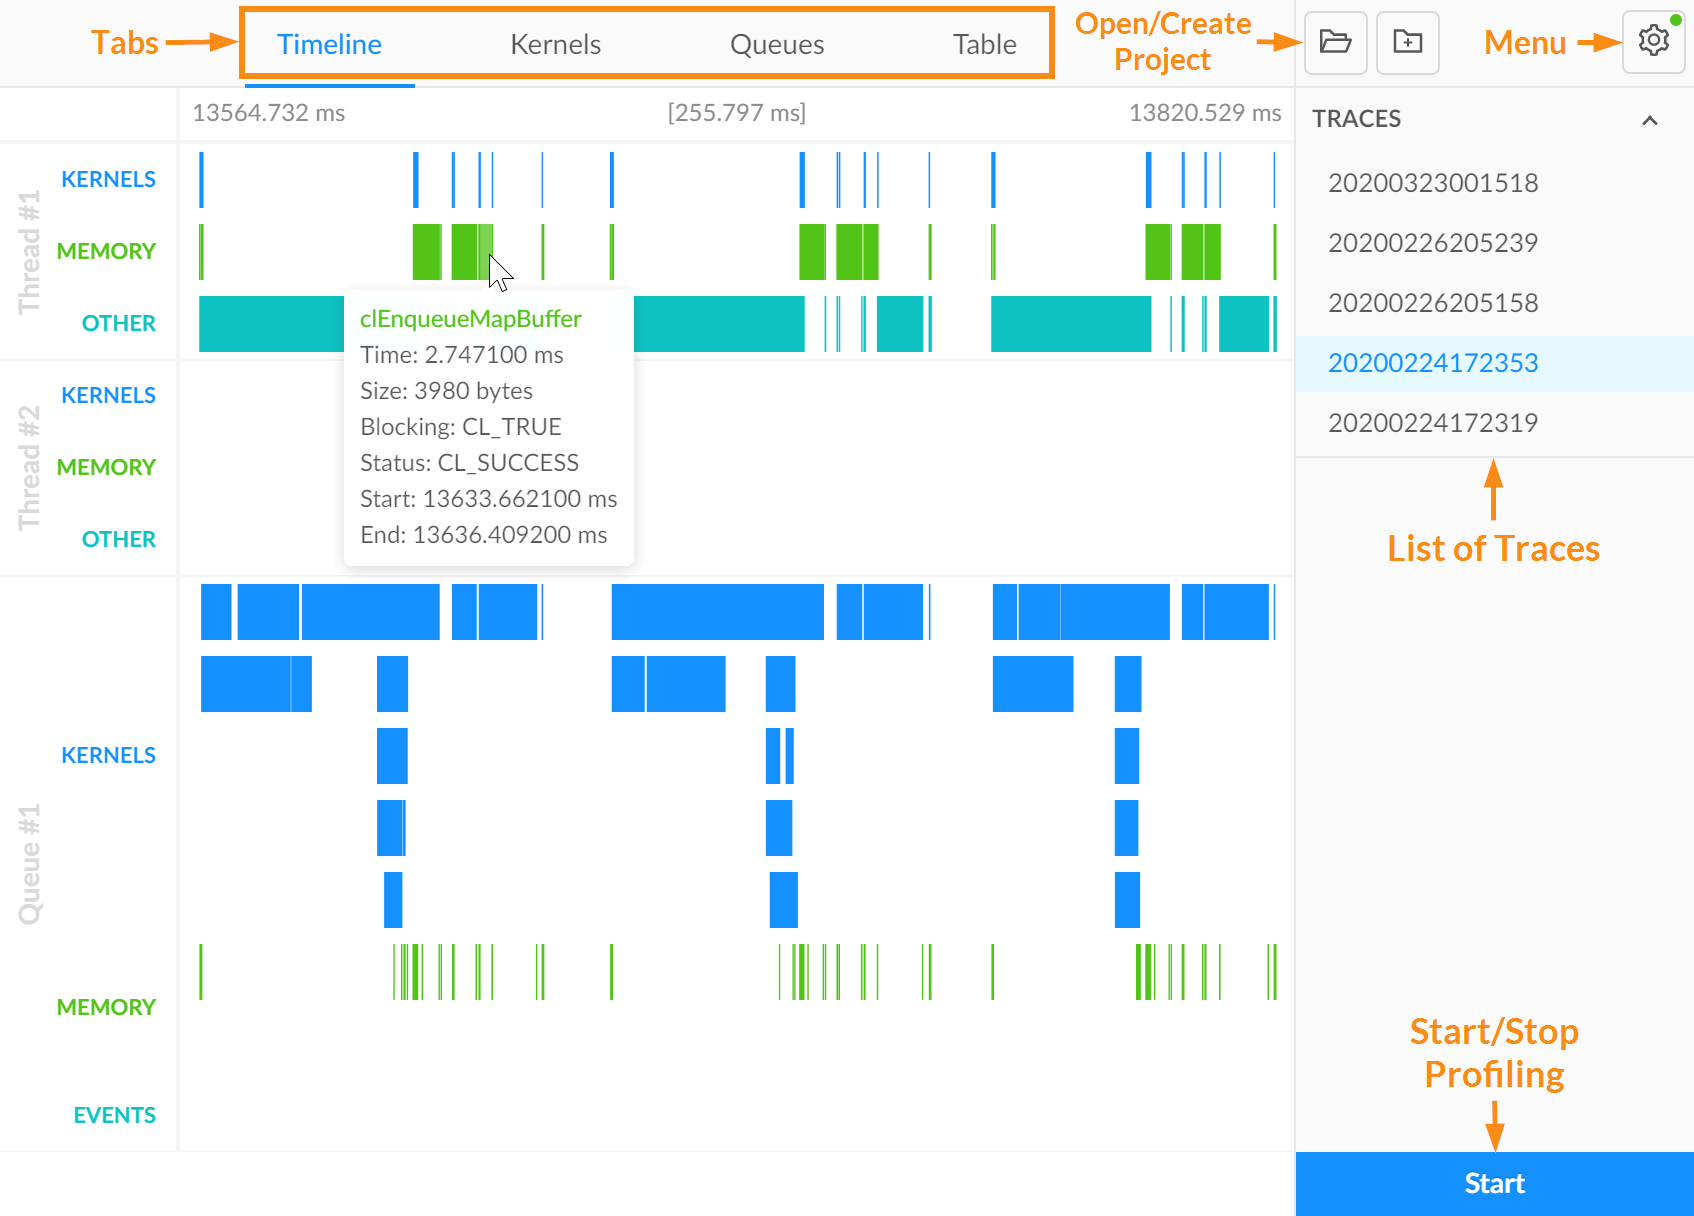
The picture shows the interface of CLtracer:
Profiling
To create a new project, press the corresponding button, and fill in the form.
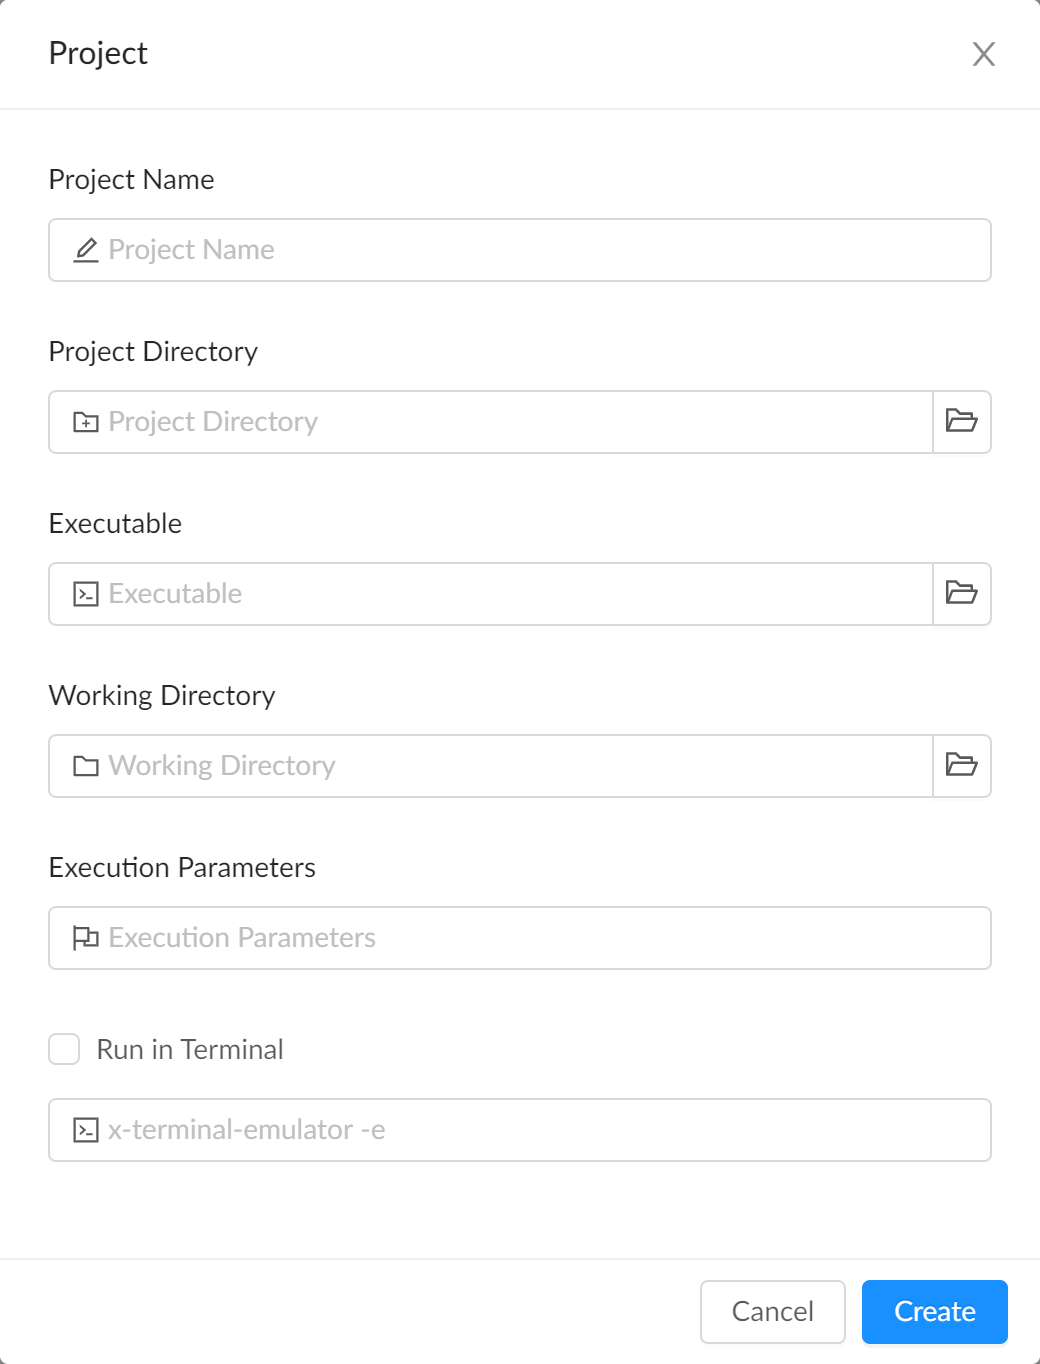
Provide the following information:
- Name and directory of the project.
- Executable - application you would like to profile.
- Optionally: working directory (by default directory of the executable).
- Command line arguments/flags.
- Whether to run the profiled application in a terminal.
- On Linux, command to run the application in a terminal.
You can change the working directory, flags, and terminal options at any time in project settings, available from the main menu.
For most Linux distros the default command to run the app in terminal (x-terminator-emulator -e) works fine. It will use the default terminal emulator. You can override it, e.g. gnome-terminal -e. Note, that when profiling in a terminal emulator, CLtracer cannot handle application exit and show a meaningful warning in case anything is wrong. If you experience any issue when running in a terminal, first try to uncheck this option and try to profile again.
Press the "Start" button to begin application profiling. Once the application closes a new trace will be opened. You can select the current trace in a list on the right. Here you can also delete or rename any trace through its context menu.
We recommend that your application exits normally by itself to finish profiling. It's also a good practice to wait for all enqueued commands using clFinish / clWaitForEvents before exit and release all OpenCL resources.
You can use the "Stop" button but in this case, trace can be truncated or even empty. First, CLtracer will try to gracefully close the application using taskkill (WM_CLOSE message) on Windows or kill (SIGTERM signal) on Linux. If the application doesn't close after 5 seconds timeout, CLtracer will forcefully terminate it by taskkill /f (WM_QUIT message) on Windows or kill -9 (SIGKILL signal) on Linux. If the profiled application doesn't properly close on WM_CLOSE/SIGTERM, profiling information may be lost.
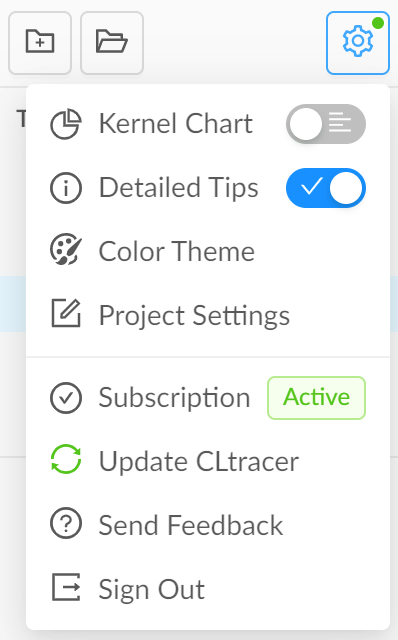
Main menu
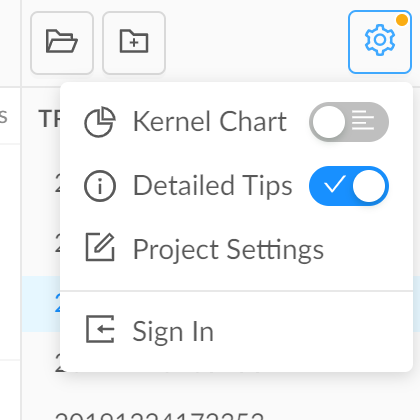
From the main menu you can:
- Change type of kernel chart (bar or pie).
- Enable detailed tooltip on hover.
- Select color theme (light, dark, system).
- Change project configuration (working directory and flags).
- Sign in/out.
- Check your subscription status.
- Check for updates.
- Update CLtracer when a new version is available.
- Send feedback.
Tabs
Finally, there are 4 tabs with information about captured trace:
- Timeline - timeline of OpenCL commands.
- Kernels - metrics for analyzes of kernel timings.
- Queues - occupancy of compute devices and memory buses.
- Threads - occupancy of host threads by OpenCL API.
- Table - table of all OpenCL command records.
Timeline
Timeline, in our opinion, is the most useful tool for analysis of OpenCL computational flow. It provides deep insight into how your pipeline actually works. You can find out what time is taken by each operation (both kernels and memory) or particular sequence, check their order and dependency chain, find bottlenecks and stalls, analyze device occupancy, determine whether computation capabilities of the device are fully utilized. Timeline allows you to zoom in up to every detail, and at the same time gives you the whole picture of how your application works. So you can explore it at both coarser and finer scales. The timeline view is pixel-perfect, highly responsive, and provides smooth control even when there are millions of OpenCL commands recorded.
Basics
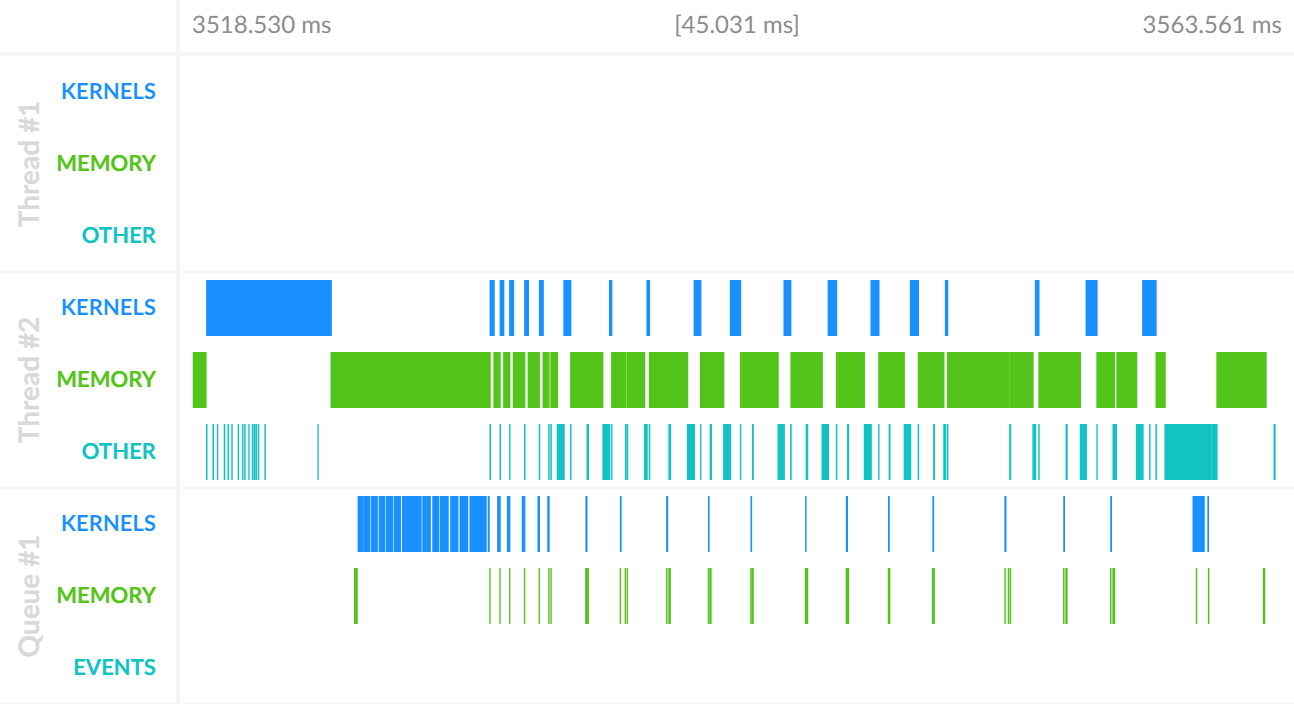
The next picture shows the basic elements of the timeline view.
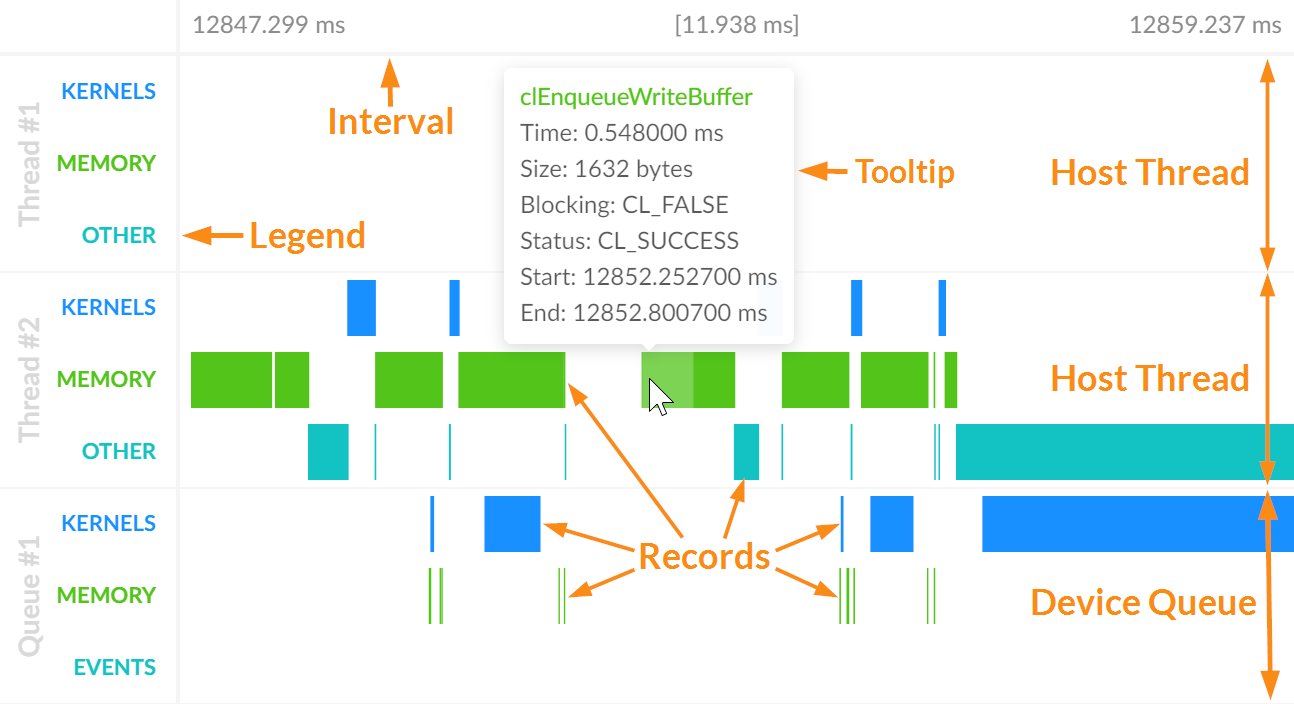
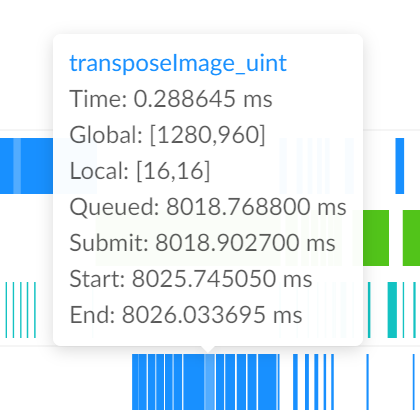
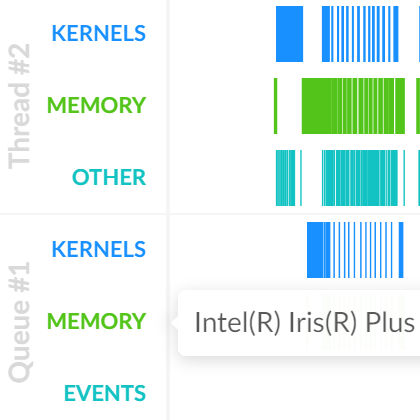
Timeline presents every OpenCL operation (record) executed by an application. CLtracer records both device and host timings. There are separate lanes for each host thread and device queue. Operations are grouped by their types: Kernels, Memory, and Other. The current interval and its duration are shown at the top, legend - at the left. On record hover, a tooltip with detailed information is shown, and the record itself is highlighted in both device and host lanes. You can choose between essential and detailed tooltip information in application settings. By hovering a device queue in a legend, you can get the name of the corresponding compute device.
Control
Here we will explain how to control the viewport time interval in the timeline. In fact, it's intuitive and easy, control is very similar to the control in the image editing apps.
- Use a mouse wheel to zoom in/out.
- Hold the left mouse button and drag to translate.
- When zooming or translating the time point under the cursor stays at the same place.
- With Ctrl modifier, you can select a range you are interested in.
- On release of the mouse button, the selected range becomes the current viewport.
- If you release Ctrl prior to the mouse button, nothing will happen. This can be used for quick time measurements.
- Double-click on a record redirects you to the corresponding row in the table.
- To scroll, you can use either a scrollbar or mouse wheel with Ctrl.
Metrics
CLtracer evaluates useful performance metrics. The most notable feature is that metrics are coherent with the timeline so that all values are provided for the current interval on the timeline. This allows you to analyze different stages of the computation pipeline independently. You can explore an app at both coarser and finer scales.
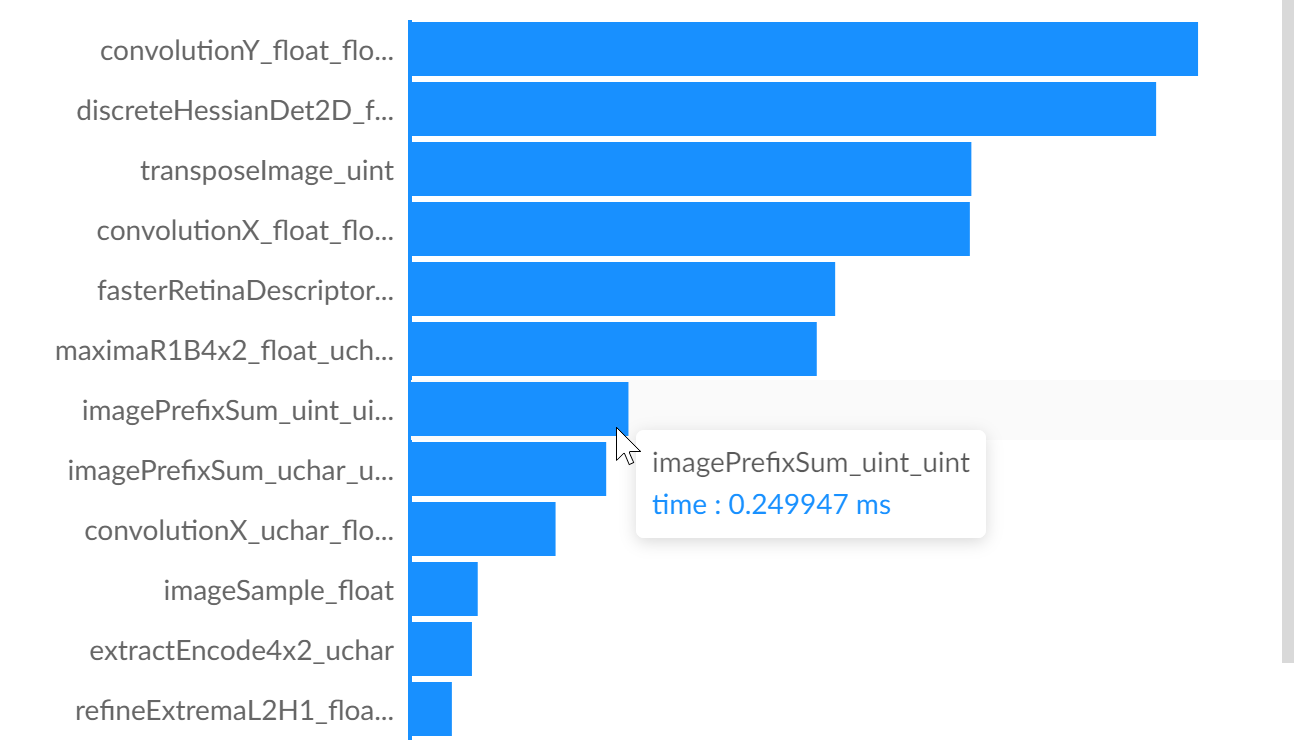
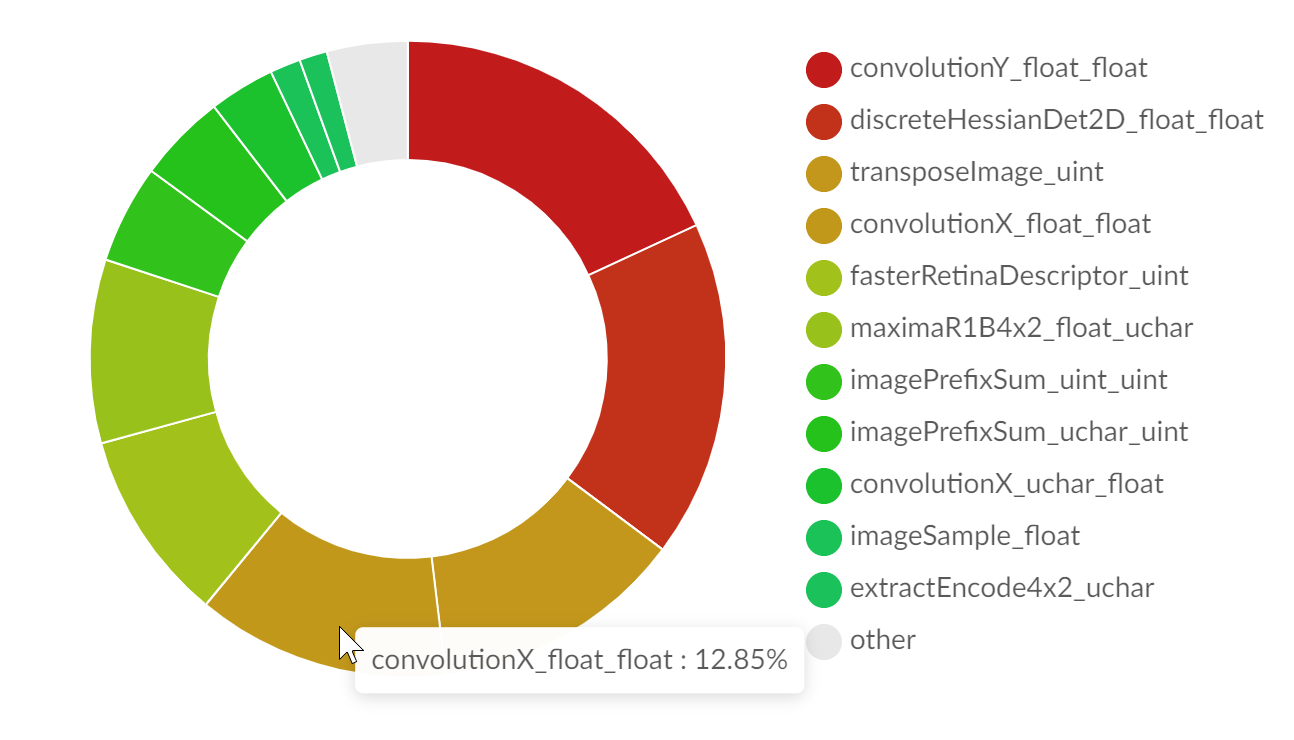
Kernels
On this tab, you can discover the total execution time of each OpenCL kernel. Two options are available: bar chart or pie chart. You can switch between them in the main menu.
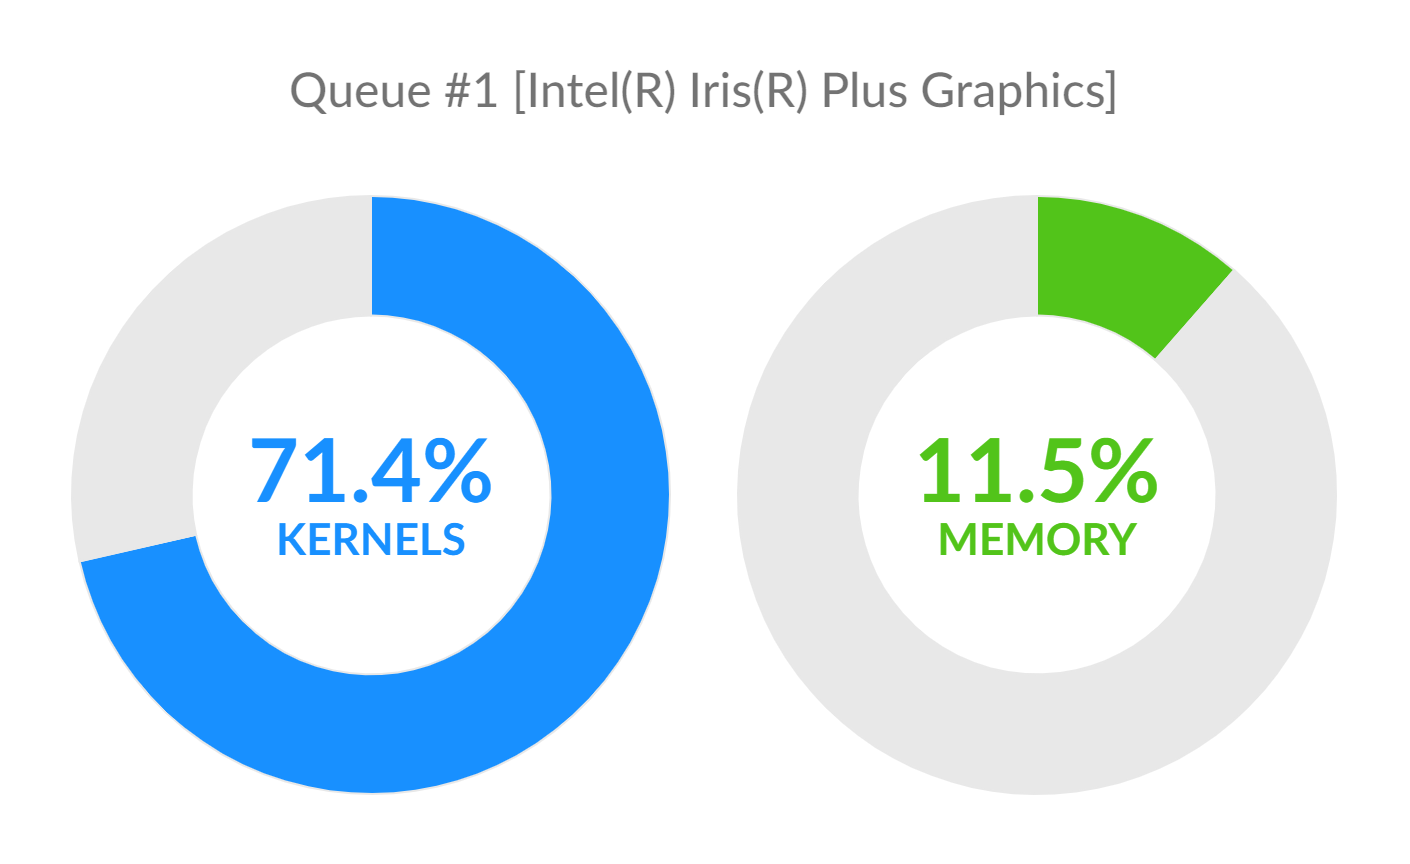
Queue occupancies
Queue occupancies show how efficiently you utilize compute devices. Here we have kernel and memory occupancies per each queue. Kernel occupancy shows what percentage of time is spent on kernels execution. The higher this score, the better utilization of compute resources of the corresponding device. The same goes for memory occupancy. If you have too low utilization of an OpenCL device or memory bus, you should first optimize computational flow, removing stalls, minimizing waits, and trying to achieve parallel execution of commands. When occupancy is high enough or further optimization of a command queue is impossible, you may try to optimize the slowest kernels.
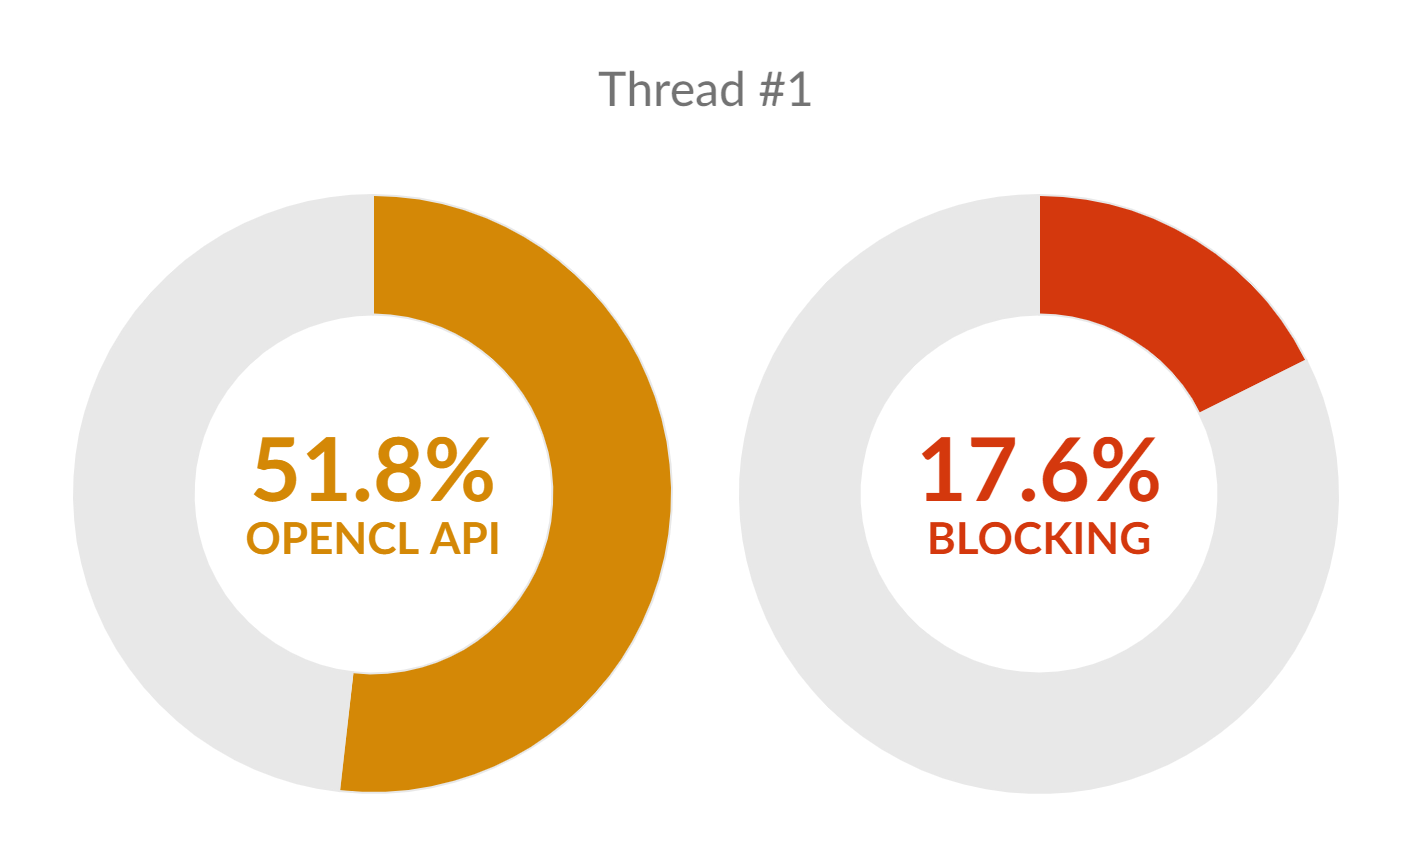
Thread occupancies
Thread occupancies show how much time host threads spend on OpenCL API. CLtracer evaluates two occupancy metrics for each thread. Percentage of time spent on OpenCL API and on blocking OpenCL commands. Too high API occupancy means that most of the time thread executes OpenCL commands. If at the same time occupancy by blocking commands is low, your application is CPU bound. This means that the host thread doesn't submit enough job to keep GPU busy and fully utilize compute resources. CPU speed is a bottleneck in this case. Otherwise, if occupancy by blocking commands is high, the thread mostly waits for GPU to finish submitted jobs. This means that the application is bound by GPU. In this case, a good optimization would be to do intensive host-side computations concurrently in another thread or before a blocking call to minimize stall.
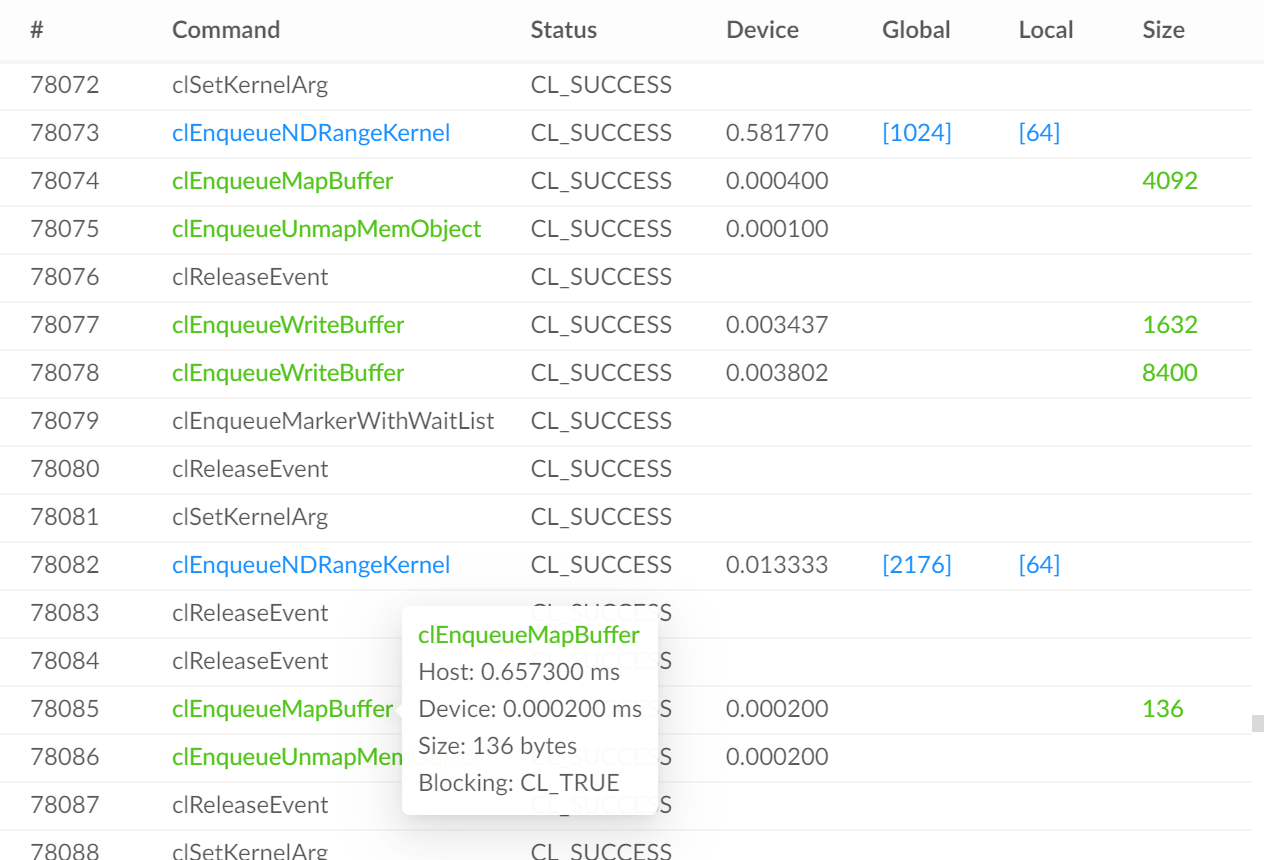
Table
Here you can find all OpenCL calls made by an application. For every call, you can revise all available information. Right click on the header of the table opens a menu where you can select columns to show. On kernel or memory command hover, a tooltip with detailed information is shown. Double click on a row redirects to the corresponding place on the timeline.
Miscellaneous
Tests
We've successfully tested CLtracer with the following applications:
Limitations
- Currently, CLtracer doesn't profile OpenCL extensions. It will profile apps that use extensions as usual but extension API won't be traced, presented on the timeline, and contribute to metrics. If you need the support of any extension, please contact us.
- Only 64-bit applications are supported at the moment.
- CLtracer will not profile processes created by a profiled application (CreateProcessA, execv, etc.). Currently, this not on our priority list.
Troubleshooting
- If you experience any problem profiling an app, first, make sure that OpenCL runtimes work without errors or faults (especially on Linux). The easiest way is to run clinfo and ensure there are no errors. On Linux, clinfo can usually be installed from repository, e.g. sudo apt-get install clinfo. clinfo for Windows can be downloaded here
- Then try to profile clinfo using CLtracer. If profiling fails, kindly report to us, if possible attach clinfo output.
- If clinfo profiles fine, but you cannot profile your app, please contact us. It will be great if you could build a minimal sample reproducing the problem and send it to us, or send us a binary of your app.
- On Linux, if timeline rendering is too slow, try to start CLtracer from the command line with --ignore-gpu-blacklist flag.
- On Linux, CLtracer requires at least glibc 2.25, so older versions of some Linux distributions may not be supported. You can query glibc version by ldd --version. We are working on support of older distributions in production builds. Meanwhile, you can contact us and we will send you insider build.
- On Linux, the latest version of PyOpenCL (2020.2.1) has a bug in a bundled ICD loader. Consider downgrading to the previous version (2020.2) pip3 install pyopencl==2020.2.
- On Windows, if CLtracer window is empty on the start, ensure Visual C++ Redistributable 2019 is installed.
- Intel GPU runtime has a bug on the latest Windows 10, version 2004. Traces could be truncated or even empty for short executions when the runtime is installed, even if you don't use iGPU directly.
- In virtual environments Python executable acts like a wrapper that in turn may create a process to execute another Python instance. CLtracer does not profile sub-processes created by a profiled application. We recommend to profile PyOpenCL scripts using the main Python executable.