Versatile. Efficient. Simple.
Cross-platform cross-vendor
OpenCL profiler.
It's free. No credit card required.
Version 1.0.5 is now available! Host metrics, Dark theme, Better support for console apps, Many improvements and fixes.
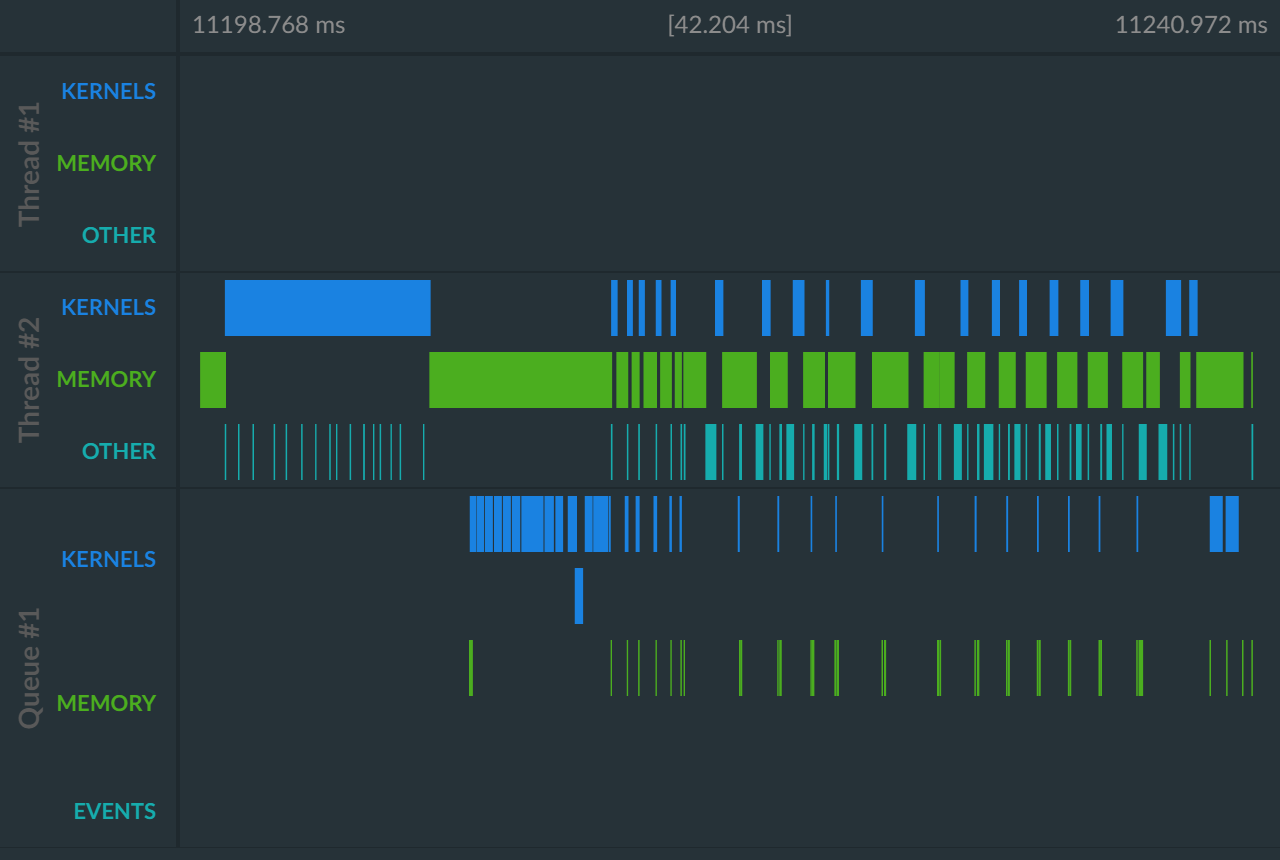
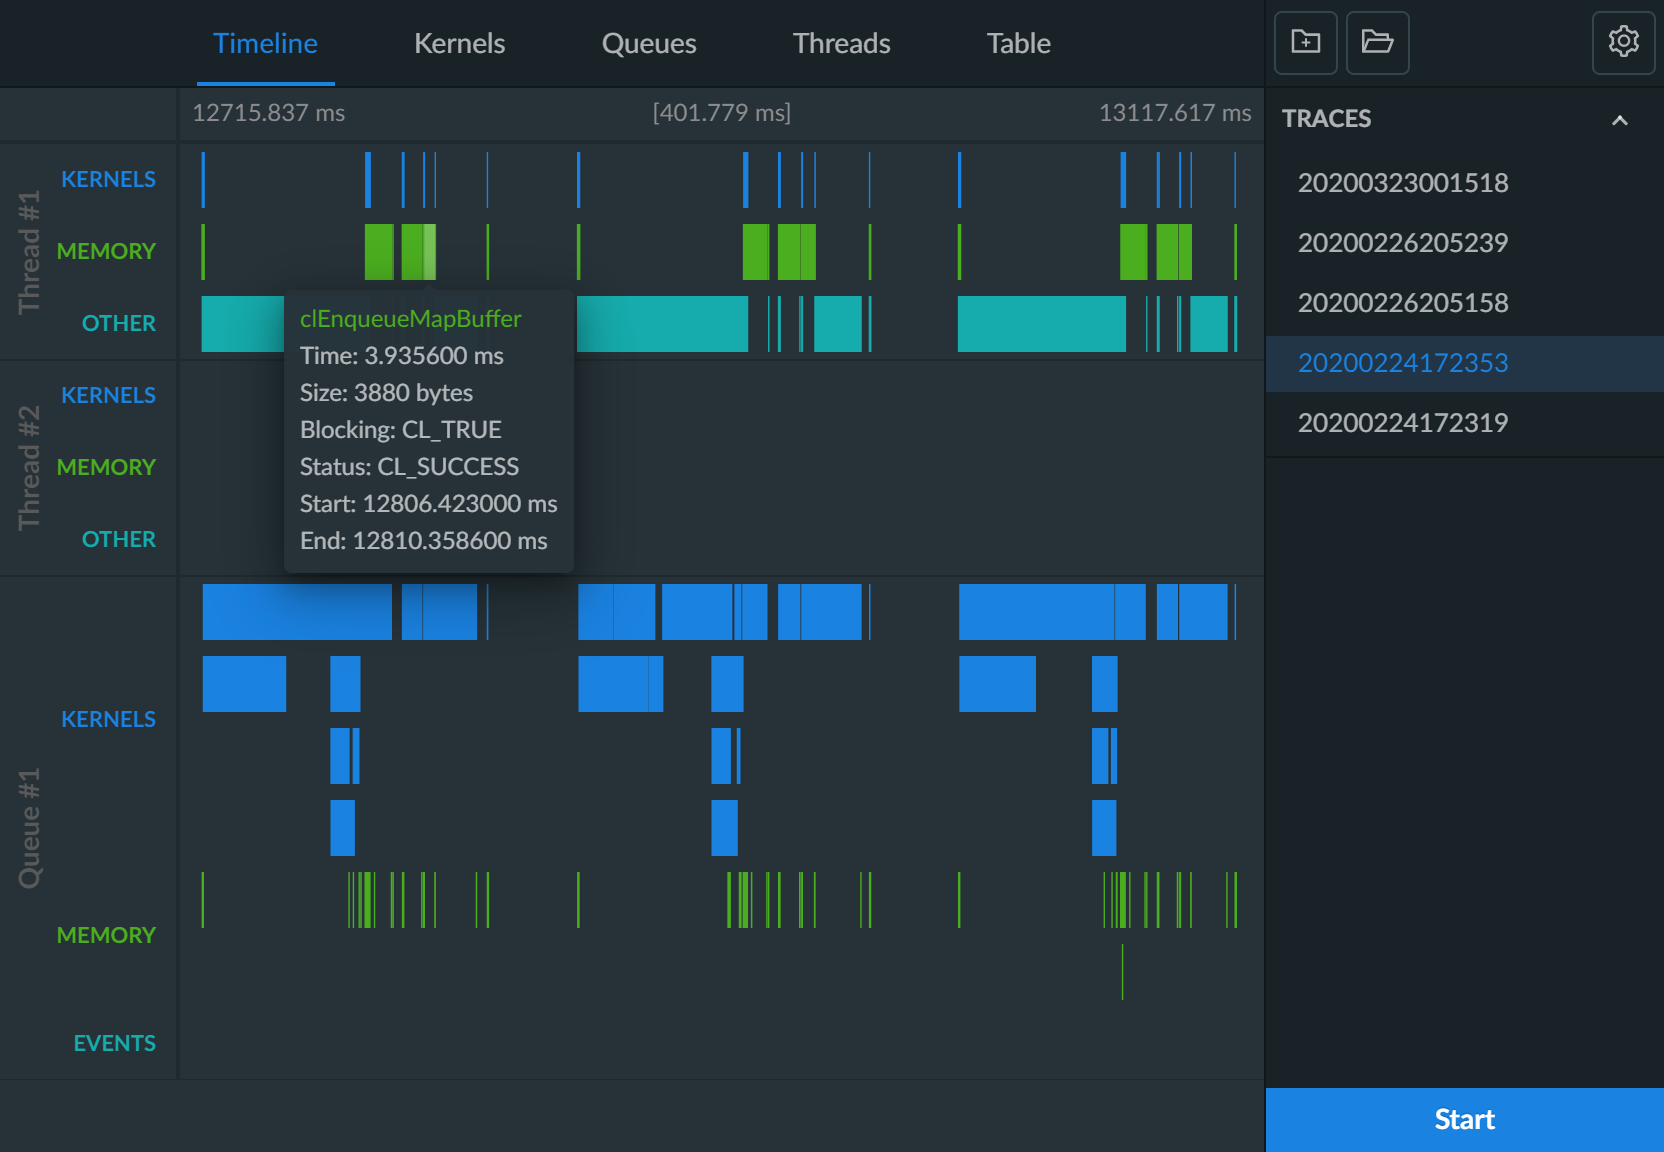
Highly responsive pixel perfect timeline
Analyze computational flow, zoom in to every detail. See the whole picture and get a deep insight into how your OpenCL application works. Explore at both coarser and finer scales.
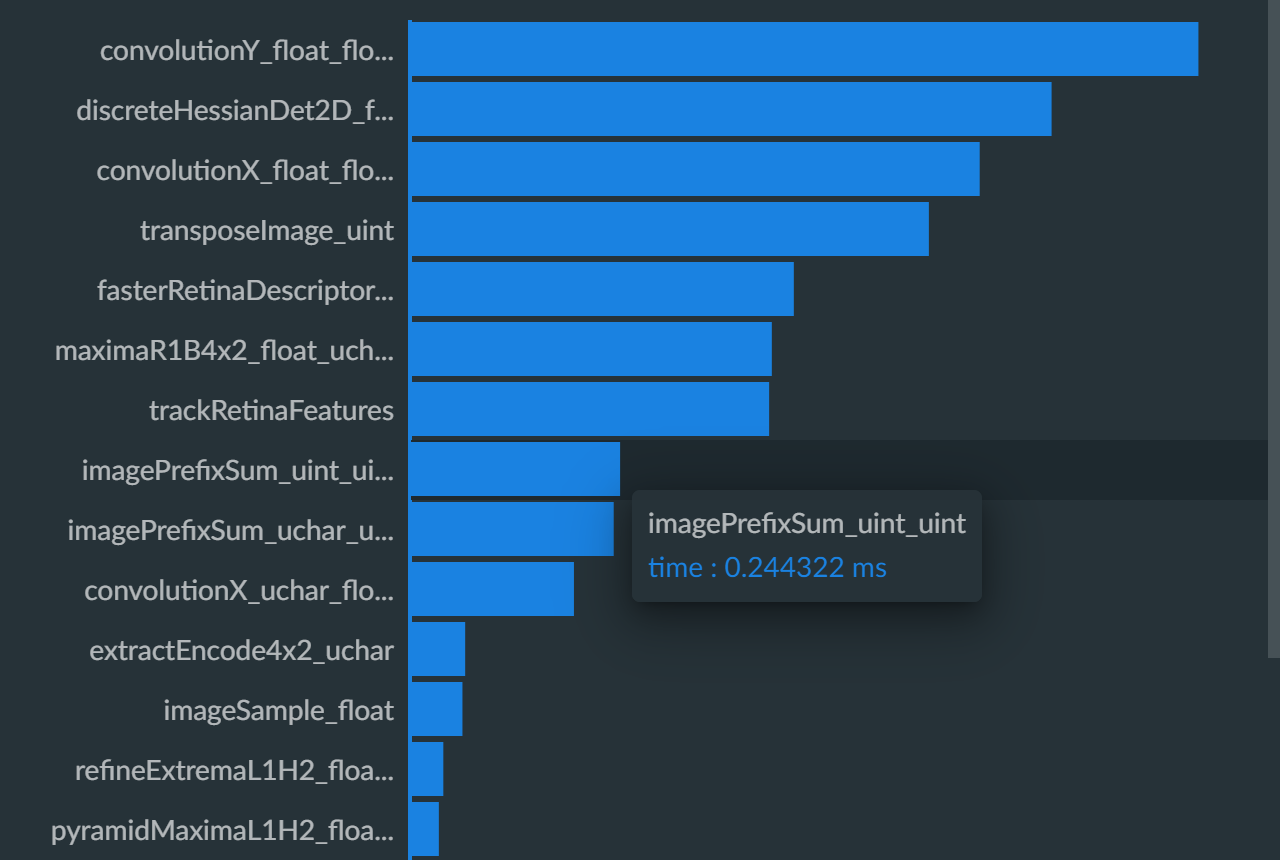
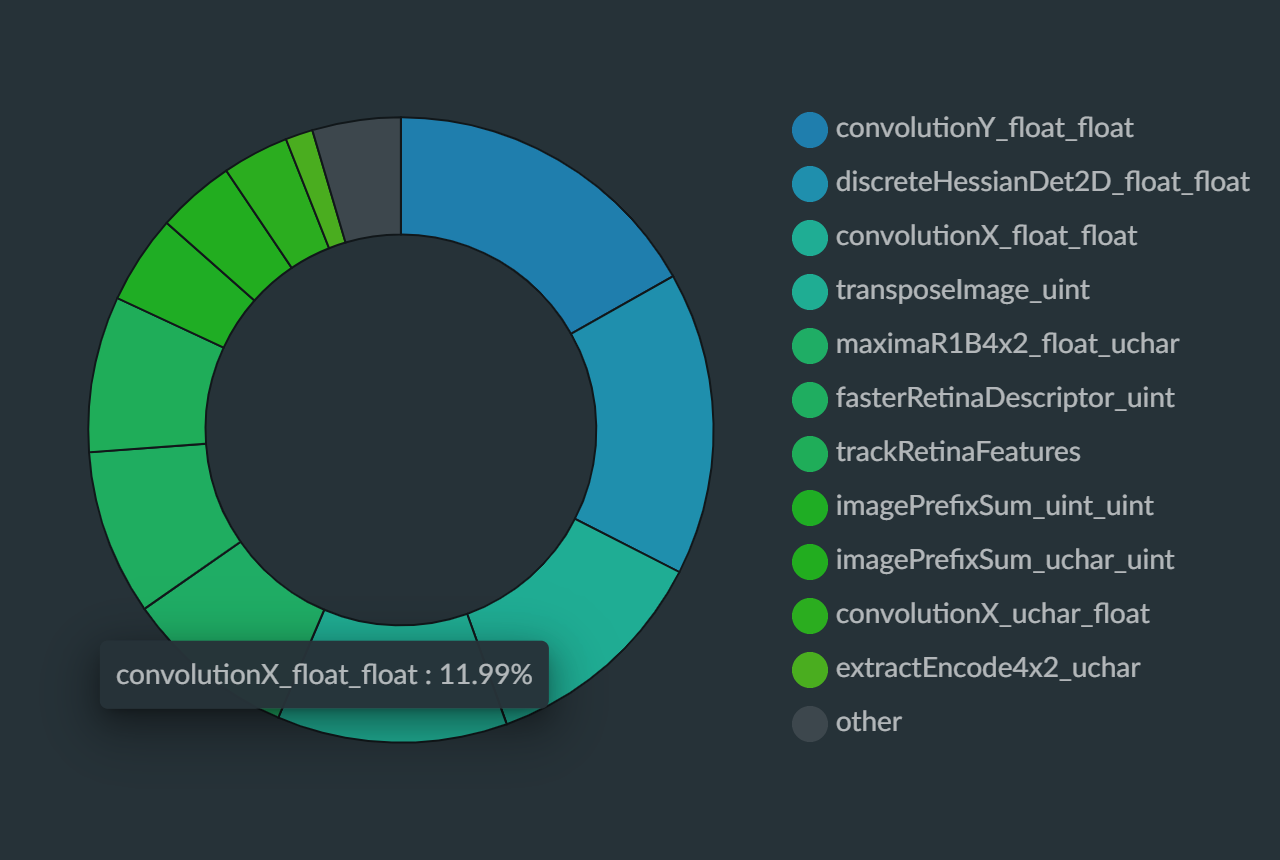
Performance metrics for optimization
Understand bottlenecks and find areas for optimizations. Determine the slowest OpenCL kernels in your program. Use one tool across all platforms and OS.
Metrics coherent with the timeline
All metrics are given for the period selected on the timeline. Analyze the stages of the computation flow independently or integrally. Focus on the most relevant time intervals.
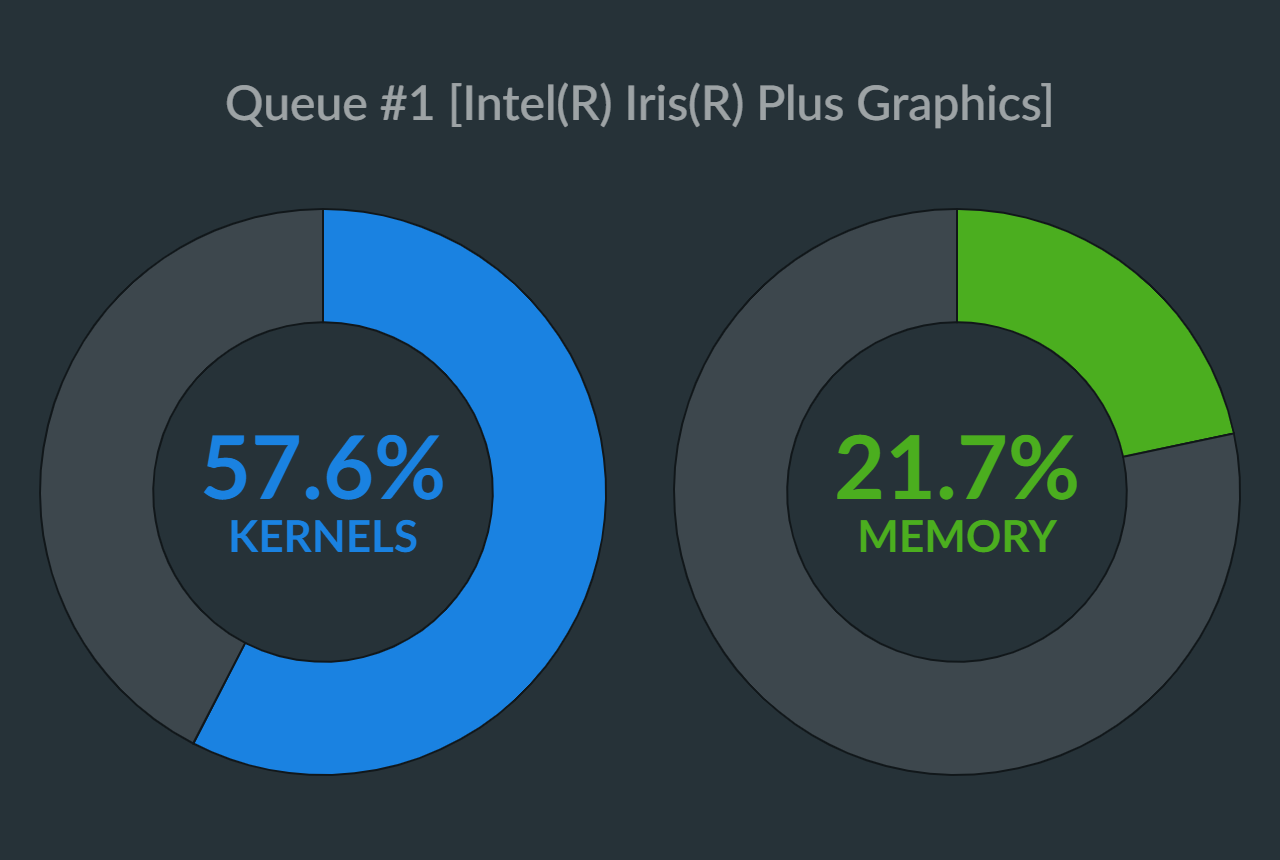
Device and host utilization
Accurate performance metrics show how efficiently your app utilizes GPU and CPU. Get a fluent developer experience - select executable and start profiling. No code changes needed.
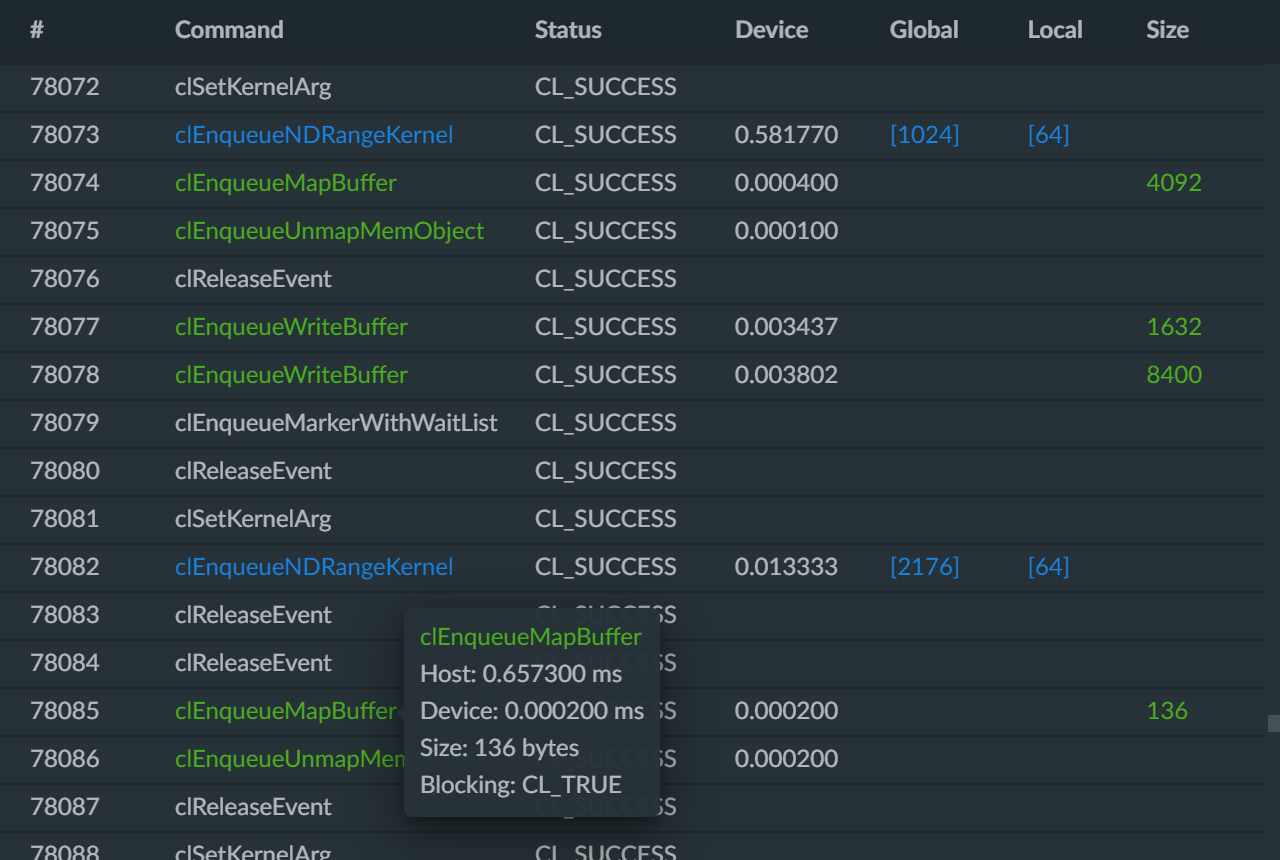
Detailed track of every command
CLtracer records every OpenCL command, its host and device execution times, delays, NDRange, amount of transferred data. It has zero overhead and doesn't impact workloads.
Start using CLtracer today
Try CLtracer for free. No credit card required.
Free trial
$0 for 32 days
Try for free for a month
No credit card required
Basic
$2.56 / mo.
All the features
Support and updates
No hidden fees
Year
$25.60
One-time payment
Save 2 months
Download CLtracer
GPU profiler for every OpenCL platform.
OpenCL and the OpenCL logo are trademarks of Apple Inc. used by permission by Khronos.
SYCL and the SYCL logo are trademarks of the Khronos Group Inc.
Other names and brands may be claimed as the property of others.
SYCL and the SYCL logo are trademarks of the Khronos Group Inc.
Other names and brands may be claimed as the property of others.
© 2020 Evgeny Peshkov. All rights reserved.